
How Is the PSAT Scored? The Honest, Data-Backed Answer for 2026
On this page
- The Short Answer: How the PSAT Is Scored in 2026
- How the PSAT Scoring Mechanism Works: Raw Scores, Scaled Scores, and Adaptive Modules
- Your PSAT Score Report Decoded: Section Scores, Subscores, and Cross-Test Scores
- PSAT Score Benchmarks by Grade: What the Numbers Actually Mean
- How the PSAT Is Scored for National Merit: The Selection Index Explained
- Reading Your Score Report: Where to Find Your Scores and What Each Number Signals
- How Your PSAT Score Translates to an SAT Starting Point
- What to Do With Your PSAT Score: A Concrete Next Step
- FAQ
- Is a 900 PSAT score bad?
- Does a 1400 PSAT score qualify for National Merit?
- Is the PSAT scored out of 1600?
- What is a top 1% PSAT score?
- How many questions can you miss on the PSAT to get a 1400?
- Is a 1200 a good PSAT score?
The PSAT/NMSQT is scored on a total scale of 320 to 1520, built from two section scores of 160 to 760: Math and Reading and Writing. You earn one point per correct answer, lose nothing for wrong or skipped questions, and your raw score is converted to a scaled score using item response theory that accounts for the adaptive difficulty of two modules per section. A separate Selection Index, calculated from your section scores, decides National Merit eligibility. The maximum is 1520, not 1600, because the test is calibrated for 10th and 11th graders.
Those numbers come directly from the College Board PSAT/NMSQT program page, which we cite throughout. The harder question is what your specific number signals about your SAT trajectory, your National Merit path, and which subscores actually deserve your prep hours. That's what the rest of this piece walks through.

The Short Answer: How the PSAT Is Scored in 2026
Here are the scoring facts, tight:
- Total score: 320 to 1520, reported in 10-point increments.
- Math section: 160 to 760.
- Reading and Writing section: 160 to 760.
- Scoring rule: rights-only. Correct answer = +1. Wrong or skipped = 0. No penalty.
- Ceiling: 1520, not 1600.
Why the lower ceiling? The PSAT is designed for 10th and 11th graders. The SAT is calibrated for seniors and beyond. Same score-scale logic across the SAT Suite of Assessments, but the PSAT stops earlier because its content difficulty is grade-appropriate. A 1520 on the PSAT doesn't mean you'd score 1520 on the SAT. It means you reached the ceiling of a test built for a younger cohort.
For a broader comparison of format and use case, see our breakdown of the difference between SAT and PSAT.
How the PSAT Scoring Mechanism Works: Raw Scores, Scaled Scores, and Adaptive Modules
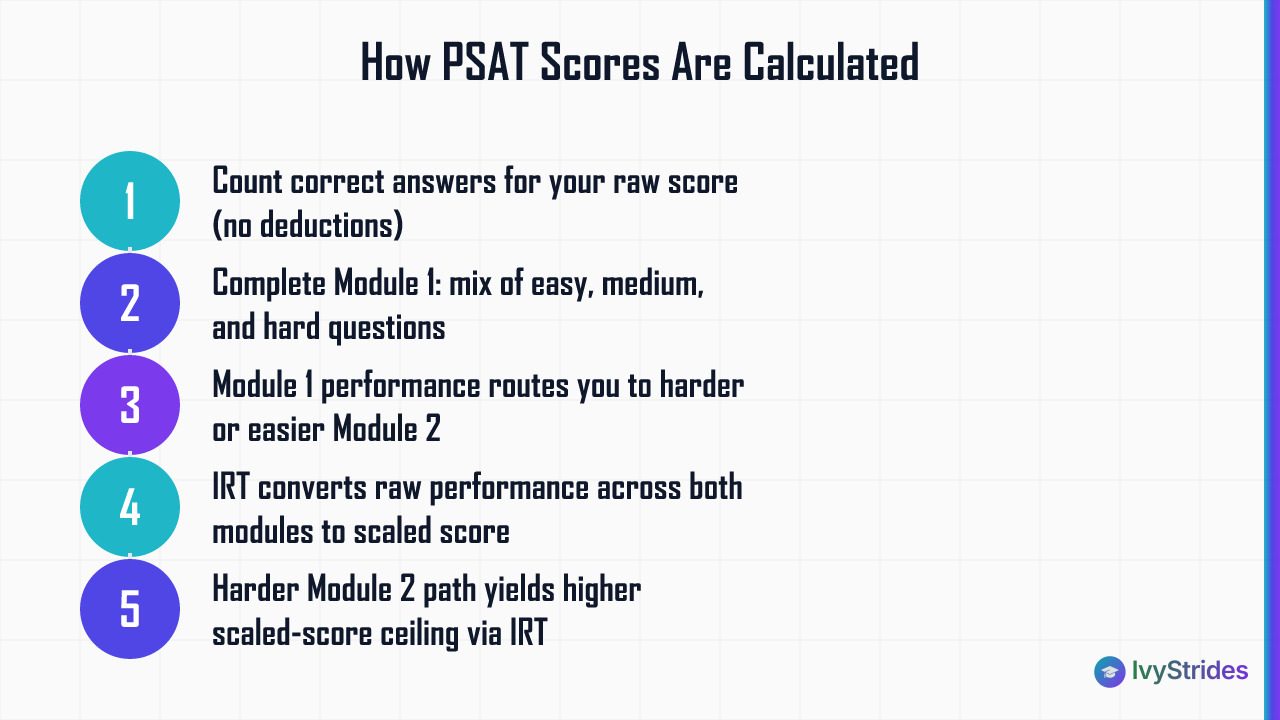
Your raw score is simple: count the number of questions you got right. That's it. No fractional points, no deductions. If you answer 40 of 54 questions correctly in Reading and Writing, your raw R&W score is 40.
The scaled score is where it gets interesting. The PSAT uses a multistage adaptive test design. Each section has two modules. Module 1 has a mix of easy, medium, and hard questions. Your Module 1 performance routes you into either a harder or easier Module 2. Item response theory (IRT) then converts your raw performance across both modules into a scaled score that's comparable across different test forms and difficulty paths.
Here's the part most students miss: a scaled score is not a simple percentage of raw score. A student who takes the harder Module 2 path and answers 35 of 44 questions correctly can end up with a higher scaled score than a student on the easier Module 2 path who answers 40 of 44 correctly. The harder path rewards you for handling harder items. IRT is what makes the comparison fair.
The PSAT uses the same multistage adaptive design as the Digital SAT, so understanding how module difficulty shifts mid-test helps you pace and strategize on both exams. For more on how the two tests relate, see is the PSAT harder than the SAT.
Two practical implications:
-
Don't skip Module 1 questions. Your Module 1 accuracy determines which Module 2 you see. Guessing well on Module 1 protects your upside.
-
Don't panic if Module 2 feels brutal. A brutal Module 2 is the signal you routed into the harder path, which has a higher scaled-score ceiling.
For the full technical breakdown, the College Board publishes the PSAT/NMSQT Understanding Scores PDF, which is the source we cite for adaptive routing and IRT.
Your PSAT Score Report Decoded: Section Scores, Subscores, and Cross-Test Scores
Your score report has more than just a total. Here's every number on it and what each one actually tells you.
Section scores (160 to 760 each): Math and Reading and Writing. These are the two numbers that add up to your total.
Seven subscores (1 to 15 scale): these diagnose specific skill areas.
- Words in Context
- Command of Evidence
- Expression of Ideas
- Standard English Conventions
- Heart of Algebra
- Problem Solving and Data Analysis
- Passport to Advanced Math
Two cross-test scores (8 to 38 scale): these measure analytical skill across both sections.
- Analysis in History/Social Studies
- Analysis in Science
Score band: around your scaled score, the report shows a range of roughly plus or minus 20 to 30 points. This isn't a mistake. It's the measurement uncertainty. A 1240 with a score band of 1220 to 1260 tells you your "true" score is somewhere in that window.
Subscores earn their keep in prep planning. In our coaching, students who audit their two weakest subscores before starting prep typically reduce wasted study time compared with students who review all content equally. A 12 out of 15 in Standard English Conventions and a 6 out of 15 in Passport to Advanced Math tells you exactly where the hours go: not more grammar drilling, more advanced math.
For the full breakdown of how percentiles map onto specific scores, see our post on PSAT score range and percentiles.
PSAT Score Benchmarks by Grade: What the Numbers Actually Mean
Once you understand how the PSAT is scored, the natural next question is what a specific number actually means for your grade level and college goals.
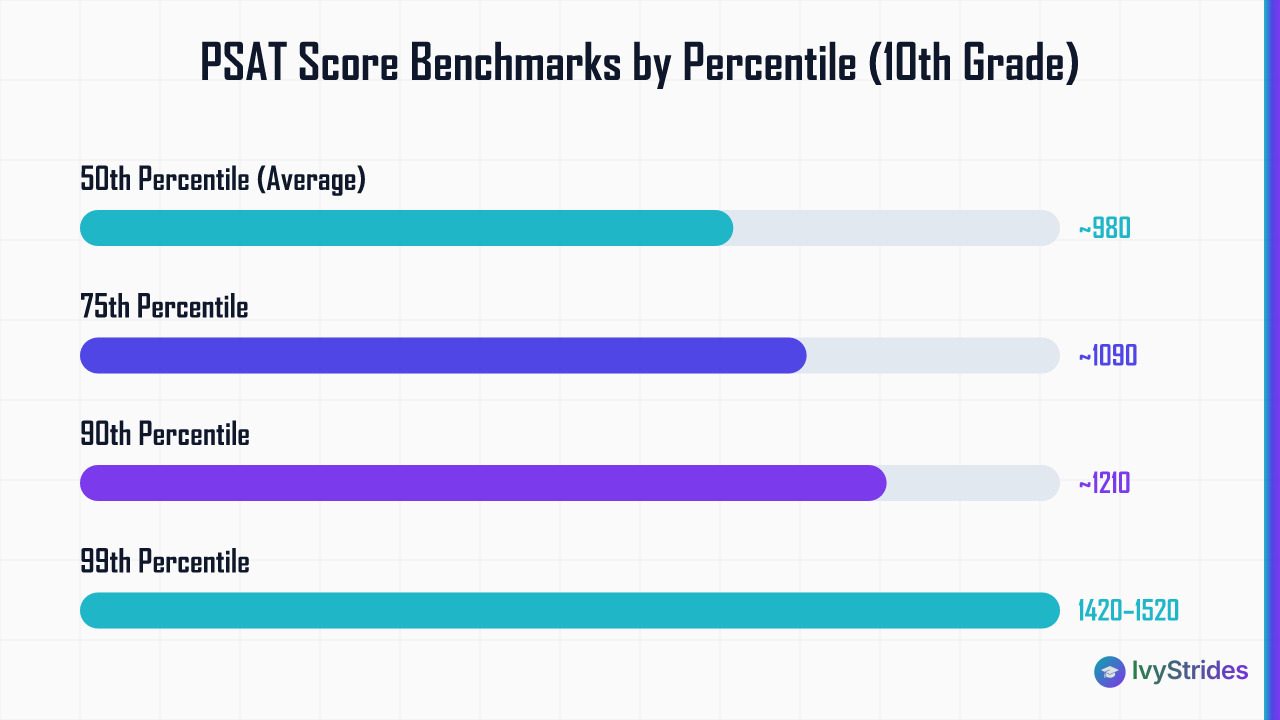
Here's the honest read on the score bands, drawn from College Board percentile data:
| Percentile (10th grade) | Approximate Total Score |
| 50th (average) | around 980 |
| 75th | around 1090 |
| 90th | around 1210 |
| 99th | roughly 1420 to 1520 |
What a 900 means: below average, near the 40th to 45th percentile. Not catastrophic. For a 10th grader, it's a starting point with a full year of runway before the junior-year PSAT that counts for National Merit.
What a 1010 means for a sophomore: slightly above average, roughly the 55th percentile. Solid baseline.
What a 1200 means: approximately the 88th to 90th percentile for 10th graders. Strong result. Above the "good score" threshold and approaching the top 10%. For a full read on this band, see is a 1280 a good PSAT score.
What a 1350+ means for a sophomore: excellent. You're in the top few percent of your grade nationally and on a trajectory toward competitive SAT scores with structured prep.
Freshman note: 9th graders typically take the PSAT 8/9, which uses a different scale (240 to 1440). Don't compare a PSAT 8/9 score directly to a PSAT/NMSQT score; the tests differ in content difficulty and ceiling.
Two percentiles, one report: your report shows both a "nationally representative sample percentile" (compared to all US students in your grade, including those who didn't take the test) and a "user percentile" (compared to actual test-takers, a more competitive pool). User percentile is usually lower. Both matter, but user percentile is the honest read on how you stack up against your realistic peer group.
For more detail on the sophomore-year benchmarks, see our guide to what is a good PSAT score and the deeper cut on good PSAT scores for 10th graders.
How the PSAT Is Scored for National Merit: The Selection Index Explained
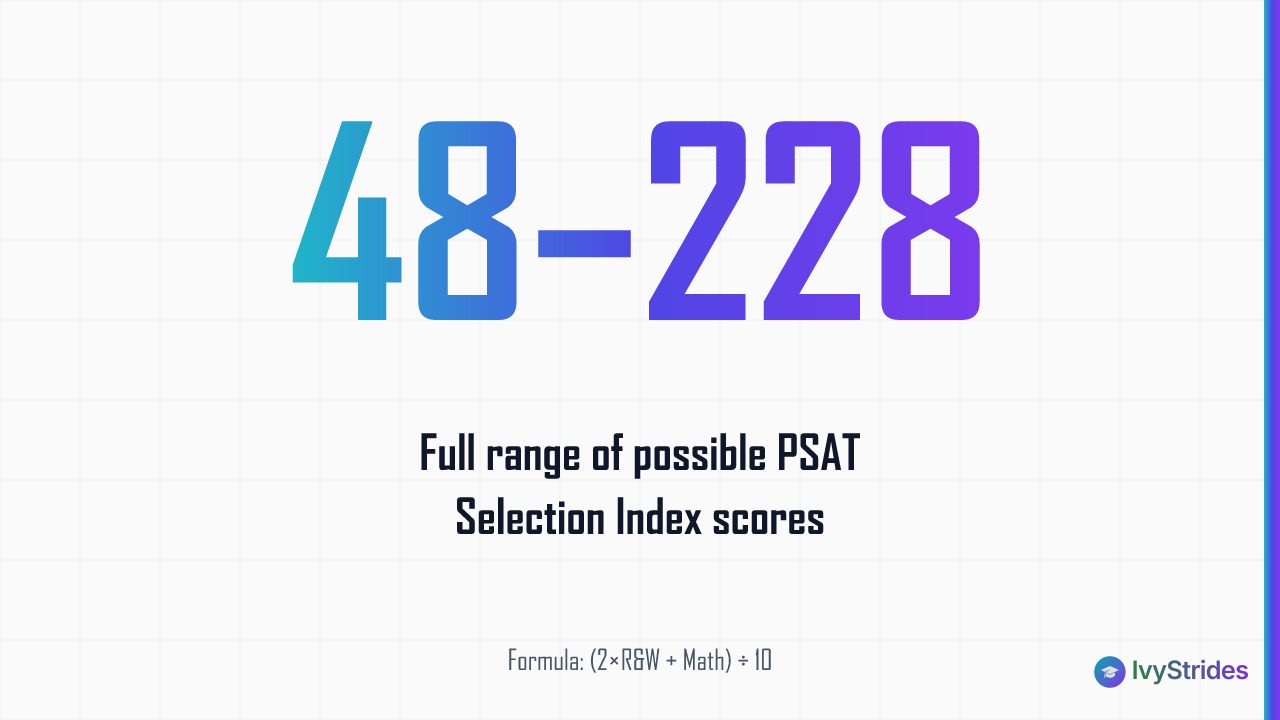
The Selection Index, a separate calculation layered on top of your section scores, is the number that determines whether you enter the National Merit pathway.
The formula:
Selection Index = (2 × Reading and Writing scaled score + Math scaled score) ÷ 10
The range is roughly 48 to 228. Notice what this formula does: it doubles the weight of your R&W score. Students chasing National Merit can't treat Math and R&W as equal. A student with a lopsided profile toward R&W has a real Selection Index advantage.
Worked example: R&W 720, Math 700.
Selection Index = (2 × 720 + 700) ÷ 10 = (1440 + 700) ÷ 10 = 214.
Two thresholds matter:
-
Commended Student: nationally uniform cutoff, typically around 207 to 209. Verify the current-year cutoff at nationalmerit.org before making decisions.
-
Semifinalist: state-specific cutoff, set by the National Merit Scholarship Corporation (NMSC). Ranges roughly from 207 in less competitive states (Wyoming, Montana, North Dakota) to about 221 to 222 in the toughest states (California, New Jersey, Massachusetts, Maryland). Cutoffs shift every year. Always verify current-year numbers.
Does a 1400 PSAT qualify for National Merit? Depends on the split and your state.
- 1400 = 700 R&W + 700 Math → Selection Index = 210. Qualifies in many states, falls short in the most competitive ones.
- 1400 = 740 R&W + 660 Math → Selection Index = 214. Better position.
- 1470 = 740 R&W + 730 Math → Selection Index = 221. Competitive almost everywhere.
Critical eligibility rule: only 11th graders (juniors) taking the PSAT/NMSQT are eligible for National Merit. A 10th grader with a 1500 isn't eligible, regardless of Selection Index. The sophomore-year test is a diagnostic. The junior-year test is the qualifier.
Semifinalist status also isn't automatic from a qualifying Selection Index. NMSC reviews the full application (score confirmation on the SAT, academic record, endorsement, essay) before naming Semifinalists and, later, Finalists.
For how strong PSAT results set up SAT performance, see PSAT results and SAT readiness. To simulate a real testing session before the score counts, work through our PSAT practice tests.
Reading Your Score Report: Where to Find Your Scores and What Each Number Signals
Scores from the October PSAT/NMSQT are typically released in mid-December. Verify the exact release date for your test administration on the College Board PSAT/NMSQT page.
You'll access your scores in two places:
-
Bluebook: the digital testing app you used on test day. Score summary appears here first.
-
BigFuture at bigfuture.collegeboard.org: the full score report with subscores, cross-test scores, percentiles, and benchmark indicators. This is the report to actually work from.
A paper copy is sent to your school. Most students ignore it. Don't.
What's on the full report:
- Total score (320 to 1520) with a score band
- Math section score (160 to 760) with a score band
- Reading and Writing section score (160 to 760) with a score band
- Seven subscores (1 to 15)
- Two cross-test scores (8 to 38)
- Nationally representative sample percentile and user percentile for each section and total
- College and Career Readiness benchmarks (met / approaching / not yet)
The benchmarks are a quick honest read. If your Math score is below the College Board benchmark (around 510 for 11th graders), that's a signal you need structured prep before the SAT, not just more practice tests. For a worked read on a specific score, see is a 1280 a good PSAT score.
One clarification worth surfacing here: your PSAT score doesn't go to colleges. It isn't part of your admissions file. It's a diagnostic and, for juniors, a scholarship qualifier. Nothing more.
How Your PSAT Score Translates to an SAT Starting Point
Because the PSAT and SAT share the same score scale logic, your PSAT result is a reliable early signal of where your SAT score would land today.
The two tests use the same 200-to-800 section-score architecture, but the SAT extends higher (400 to 1600) because it includes harder items your PSAT never showed you. A 1300 PSAT doesn't automatically become a 1300 SAT. In our coaching, students who take the SAT within a few months of the PSAT without additional prep typically land within roughly 20 to 80 points of their PSAT total on the SAT, sometimes lower if they see more advanced Math content they haven't practiced.
The bigger story is what happens with targeted prep. In our coaching, students at the 1100 to 1300 PSAT band who use their subscore breakdown to drive SAT prep typically see 80 to 150 point SAT gains over roughly 10 to 16 weeks of targeted work. Notice the framing: subscore-driven, not "review everything". A student with a strong 680 R&W and a weak 520 Math shouldn't spend equal hours on both sections.
The College Board SAT Suite publishes concordance data showing PSAT-to-SAT relationships across score bands. Use it as a directional read, not a promise.
If you're still deciding how these two tests fit into your plan, see our comparison of the PSAT vs SAT. Then work through the round-up of the best PSAT practice tests before your next sitting.
What to Do With Your PSAT Score: A Concrete Next Step
A full-length PSAT practice test taken under timed conditions is the most accurate way to see where your score would land before test day. But if the test has already happened and you have a report in hand, here's the three-step framework we use with new students:
Step 1: Benchmark the total against grade-level percentiles. Where does your total sit? 50th percentile? 90th? Above the Commended Student threshold? Write down the gap between your current score and your target. Not a vague target. A number.
Step 2: Audit the two weakest subscores. Pull up the report. Rank all seven subscores from lowest to highest. The bottom two are your prep priorities. This is the single most important step and the one most students skip.
Look at a common pattern. A student scoring 1100 might show subscores of 12/15 Words in Context, 11/15 Command of Evidence, 10/15 Expression of Ideas, 12/15 Standard English Conventions, 6/15 Heart of Algebra, 5/15 Problem Solving and Data Analysis, and 7/15 Passport to Advanced Math. That student doesn't need "more PSAT prep". That student needs Math-specific work across all three Math subscores. In our coaching, redirecting prep hours to that pattern typically drives the fastest Math section gains in the roughly 8- to 12-week window.
Step 3: Build a targeted plan. Diagnostic-driven, not curriculum-driven. Every plan we build at IvyStrides starts from a real practice test, then targets the two or three subscore areas worth the most points, then uses spaced retesting to verify the gains stick.
Where to go next:
- Take a full-length practice test to establish your true baseline. Start with our PSAT practice tests.
- For additional problem sets and study guides, browse the free downloads library.
- If your score gap is large or your target is National Merit, consider 1-on-1 PSAT prep with a section specialist matched to your weakest subscores.
For students completing a structured PSAT/SAT prep program, an 80 to 150 point SAT gain over roughly 10 to 16 weeks is typical. Not guaranteed. Typical, and only for students who actually complete the work.
FAQ
Is a 900 PSAT score bad?
No. A 900 sits near the 40th to 45th percentile, below the average of around 980 but not a failing result (the PSAT has no pass/fail threshold). For a 9th grader, it's a reasonable starting point with a full year of runway before the junior-year test. For an 11th grader, it signals a meaningful gap from competitive SAT territory and calls for a structured, diagnostic-driven prep plan focused on the weakest two subscores first.
Does a 1400 PSAT score qualify for National Merit?
Depends on your state and how your score is split between sections. National Merit eligibility is based on the Selection Index, not the total. A 1400 with 700 R&W and 700 Math yields a Selection Index of around 210, which qualifies in many states but falls short in the most competitive ones like California, New Jersey, and Massachusetts where cutoffs reach roughly 221 to 222. The same 1400 with 740 R&W and 660 Math yields a higher Selection Index of about 214 because R&W is double-weighted. Always verify current-year cutoffs at nationalmerit.org.
Is the PSAT scored out of 1600?
No. The PSAT/NMSQT maximum is 1520, not 1600. The SAT goes up to 1600 because it's calibrated for college-ready seniors. The PSAT is calibrated for 10th and 11th graders, so its ceiling is set lower to reflect grade-appropriate content difficulty. Both tests share the same score scale design.
What is a top 1% PSAT score?
For 10th graders, roughly 1420 to 1520 places a student in the top 1% (99th percentile). The 99th percentile section benchmarks are around 700 for Reading and Writing and about 740 for Math. Scores in this band are also above the National Merit Semifinalist cutoff in most states, though not always in the most competitive ones.
How many questions can you miss on the PSAT to get a 1400?
No fixed number, because the PSAT uses adaptive scoring via item response theory. The difficulty of the questions you face affects how your raw score converts to a scaled score. On a harder Module 2 path, you can miss more questions and still reach 1400 than on an easier Module 2 path. As a rough guide, students reaching 1400 typically answer around 85 to 90 percent of questions correctly across both sections, but the exact count varies by test form. Taking a full-length practice test is the most reliable way to calibrate.
Is a 1200 a good PSAT score?
Yes. A 1200 places a 10th grader near the 88th to 90th percentile, meaning you scored higher than roughly 88 to 90 percent of test takers. It's above the typical "good score" threshold of around 1010 and approaching the top 10%. For National Merit purposes, though, a 1200 is below the Commended Student threshold of about 207 to 209 on the Selection Index, so students targeting National Merit recognition would need to push meaningfully higher, particularly on R&W.
Your PSAT score report is a diagnostic map, not a verdict. The number at the top matters less than the subscore breakdown underneath, and the subscore breakdown matters less than what you do with it in the next 8 to 16 weeks.

Award-winning author (South Asian Book Award) and graduate of BITS Pilani and UCLA Luskin School of Public Affairs. Brings a published writer's eye to Common App essays and grammatical precision to SAT and ACT R&W instruction.